Announcement

Collapse
No announcement yet.

How to View Systemctl Logs

Collapse
X
Collapse
  •  

  • How to View Systemctl Logs

    The systemd is one of the widely adopted init systems on Linux. The key advantage of systemd is its ability to manage the system logs. It collects all the kernel messages and user processes into a log called Journal. The journald is the daemon that captures and manages the logs in a binary file. This daemon has the key benefit of storing data in structured and indexed form, making it easy to access and analyze through the journalctl utility.
    In this guide, I will be covering how to view systemd logs on Linux using different command line utilities.

    Note: The commands mentioned in this guide are performed on Ubuntu. They will work without errors on all Linux distributions that come with the systemd init system.

    Methods to View systemctl Logs

    There are two approaches to viewing systemd logs on Linux:
    The systemctl gives the most recent service-specific logs, while journalctl gives in-depth system-wide logs of all services and the specific service.

    I will explore both utilities to view systemd logs. But first, let’s understand the key difference between systemctl and journalctl commands.

    What is systemctl

    Systemctl is a command line utility that manages systemd services, such as enabling or disabling the service and viewing the status. The systemctl status command also prints a few log lines of the service at the bottom of the output, and this log is after the recent boot. However, these log lines of the service are from after the current boot only.

    What is journalctl

    The journalctl is a command line utility used to print the logs collected by systemd. Compared to systemctl, it provides detailed output with filtering options. This utility is designed to:
    • Read logs (Oldest log comes first)
    • Monitor logs
    • Filter logs based on time, service, or user

    The systemd collects logs from kernel, services, and daemons and stores them in a centralized place.

    How to View Log of a Service using systemctl

    The general syntax to find the log of a service using the systemctl utility is mentioned below.

    systemctl status [service-name]


    For example, to view the log information of the smbd.service use the command given below.

    systemctl status smbd.service
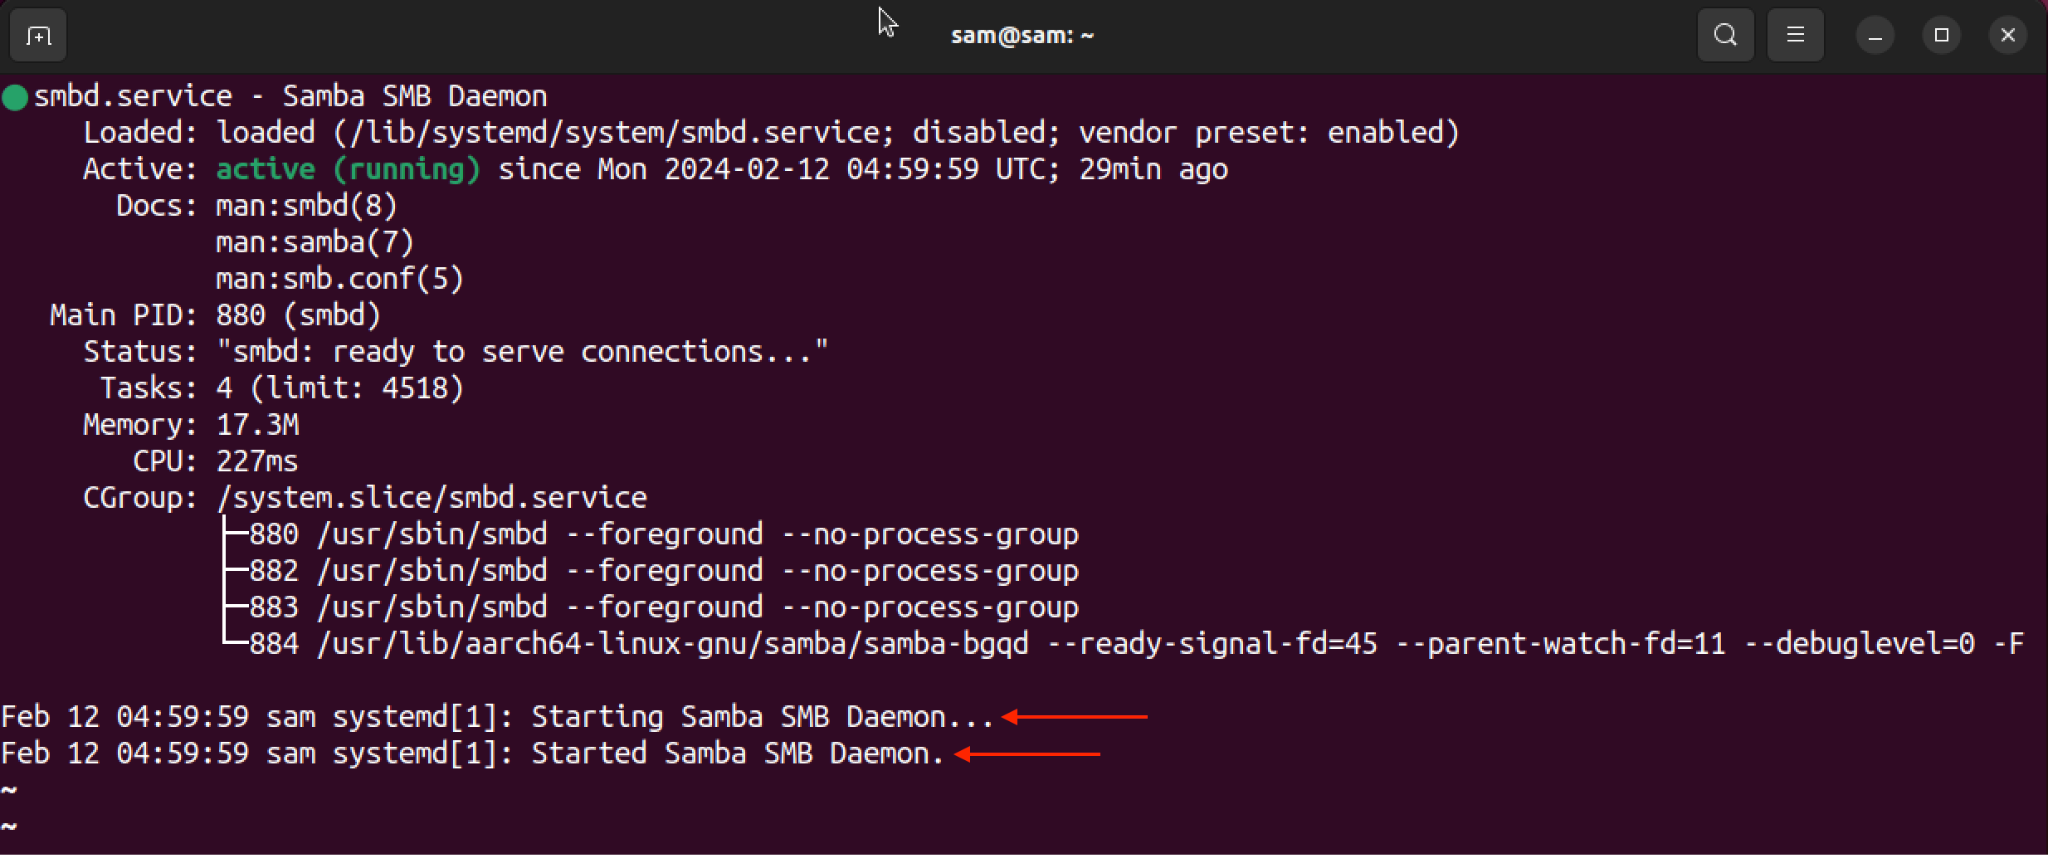


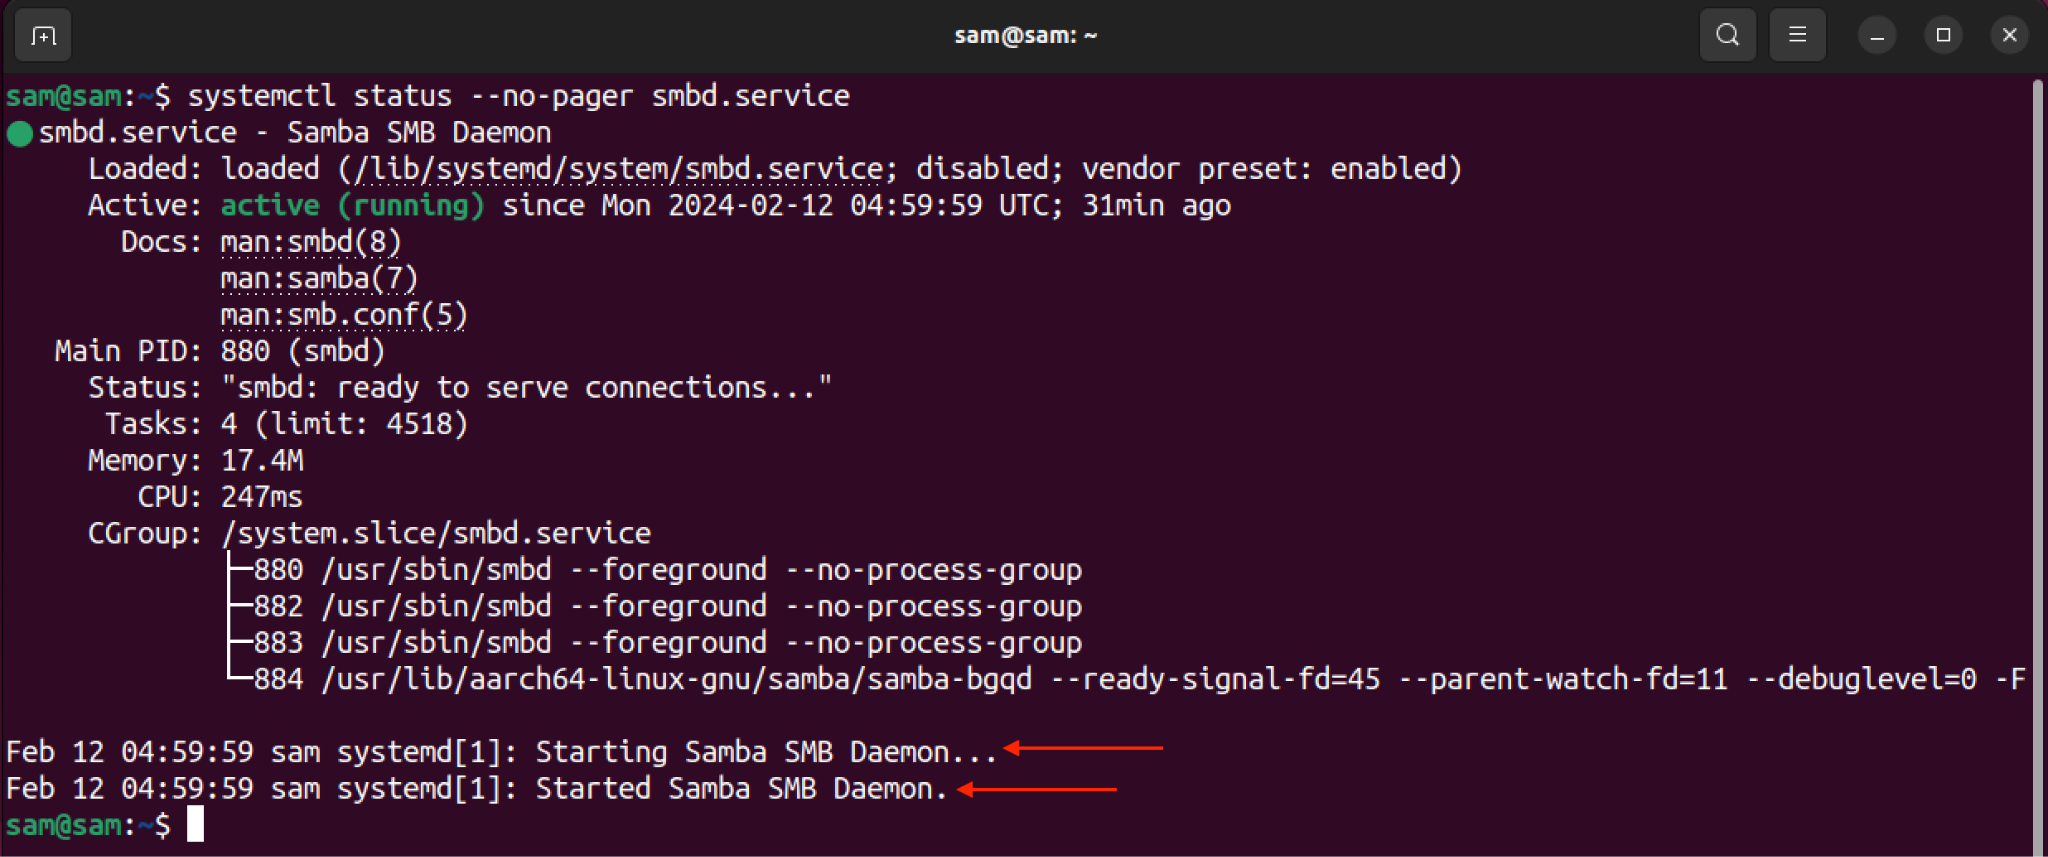
    To get output without pagination, add the –no-pager option in the command.

    systemctl status smbd.service --no-pager


    How to View Log of a Service using journalctl

    To view the log of a specific service of systemd, use journalctl with the -u command and service or unit name.

    journalctl -u [service-name]


    In the above command, the -u flag, short for –unit is used to filter the journalctl output by a unit name.

    For example, to print the log of the smbd daemon, I will replace the [unit-name] with smbd.service.

    journalctl -u smbd.service
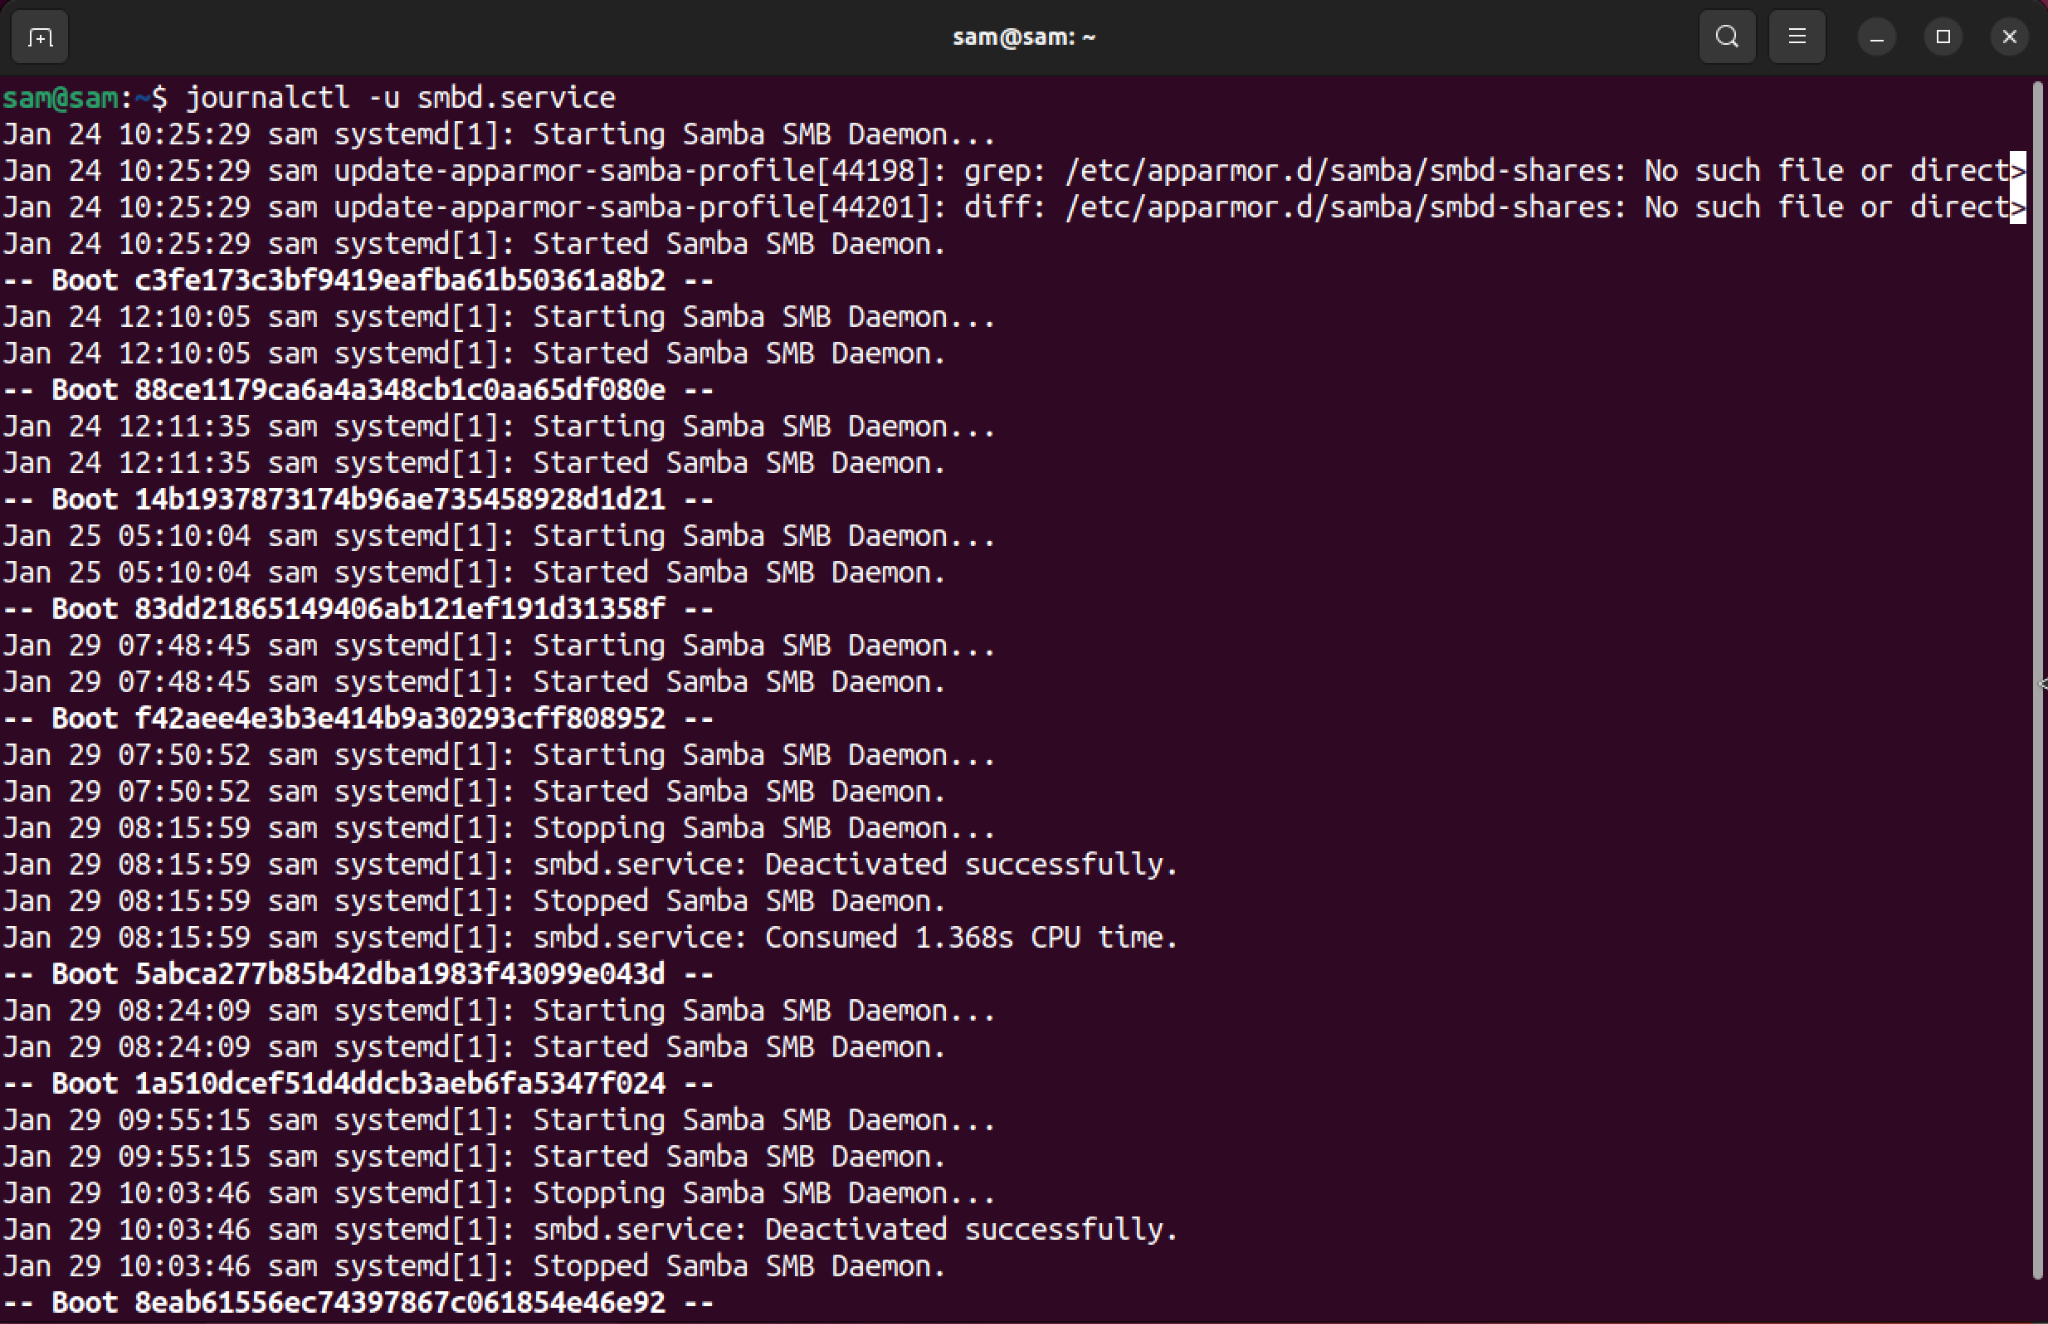


    In the output, it can be seen that the oldest entry comes first and then logs after each boot is listed.

    To get the latest entry first use -e short for –pager-end.

    journalctl -u smbd.service -e
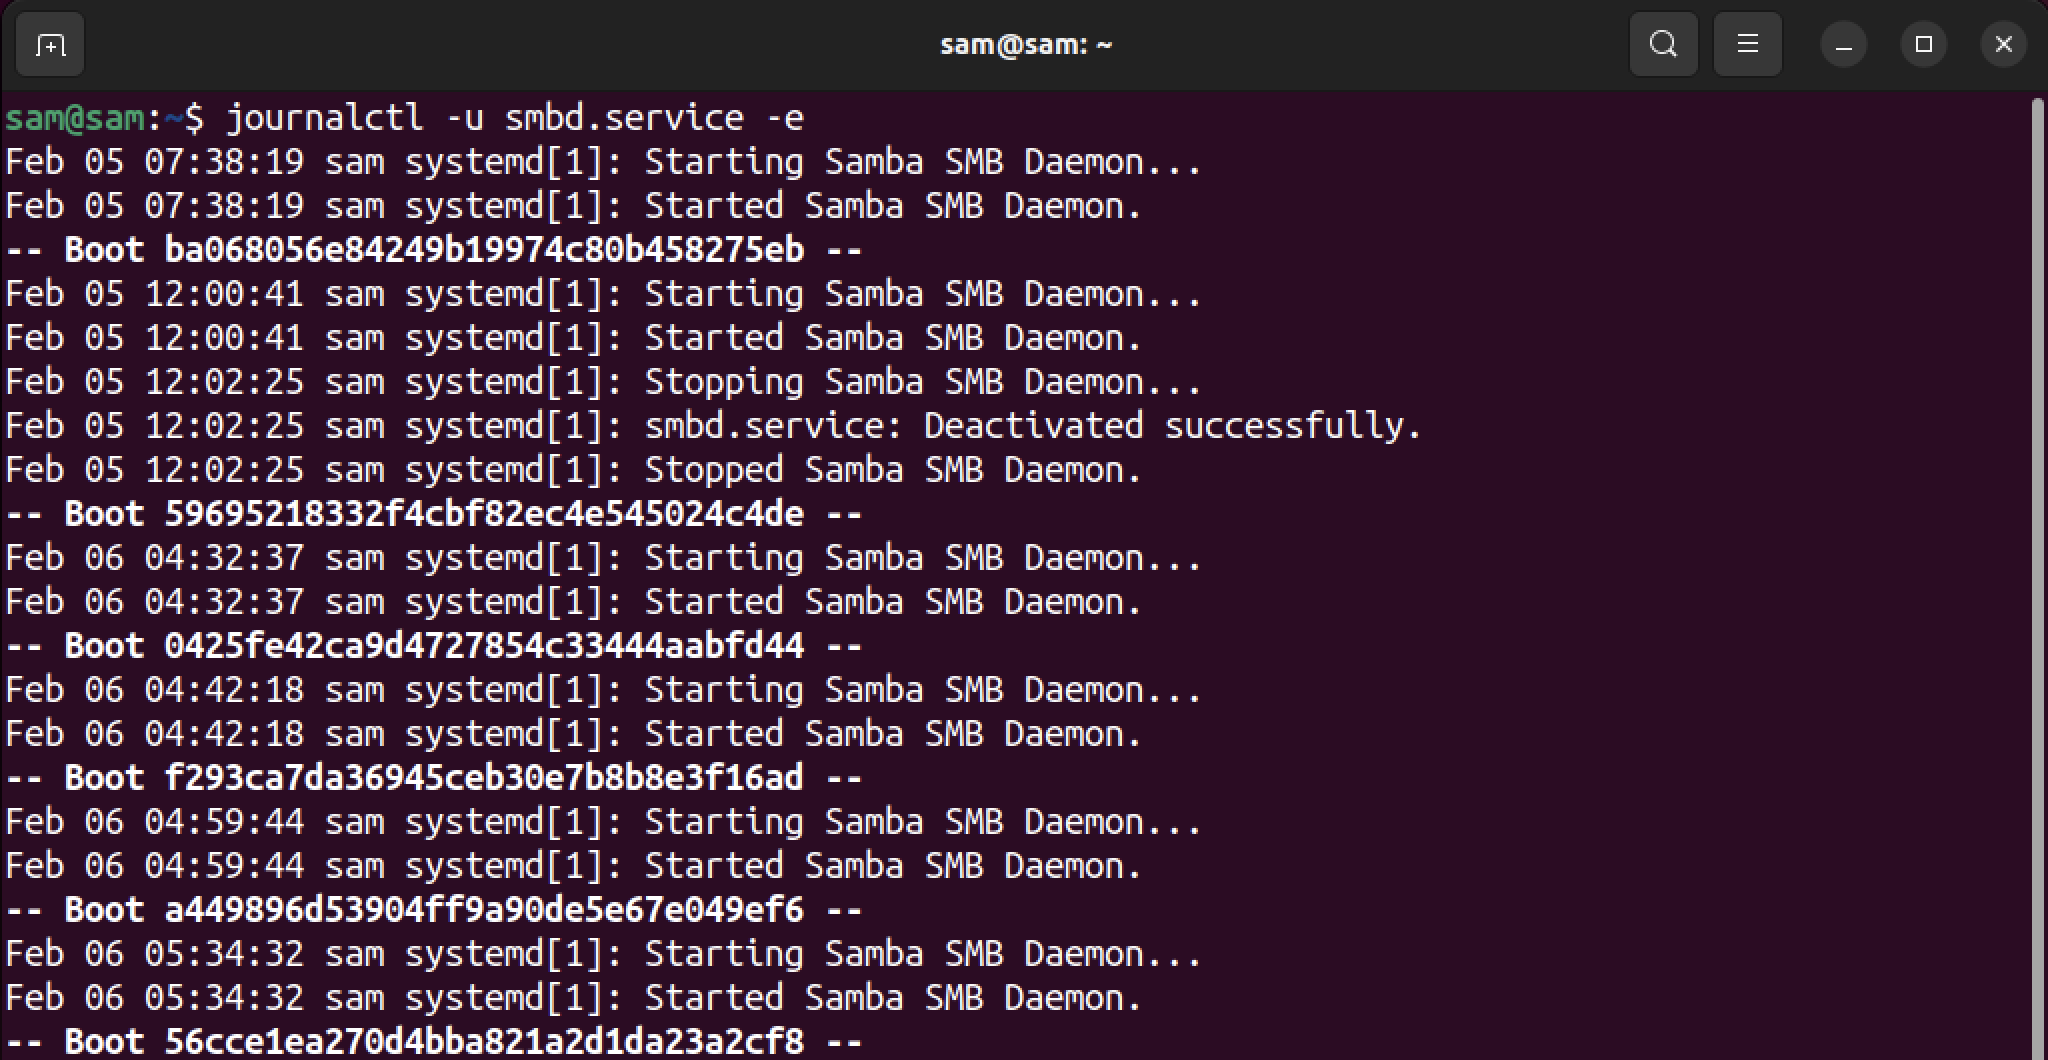


    If you want to omit the pagination from the output, simply append the –no-pager in the above-mentioned commands.

    To continuously print the log entries in real-time use -f short for –follow.

    journalctl -u smbd.service -f


    The filtering can further be expanded by using the -b flag short for –boot, which prints the logs based on the current boot.

    journalctl -u [unit-name] -b


    Let’s print logs of the smbd.service from the recent boot.

    journalctl -u smbd.service -b


    The above output resembles the output we get using the systemctl status command.

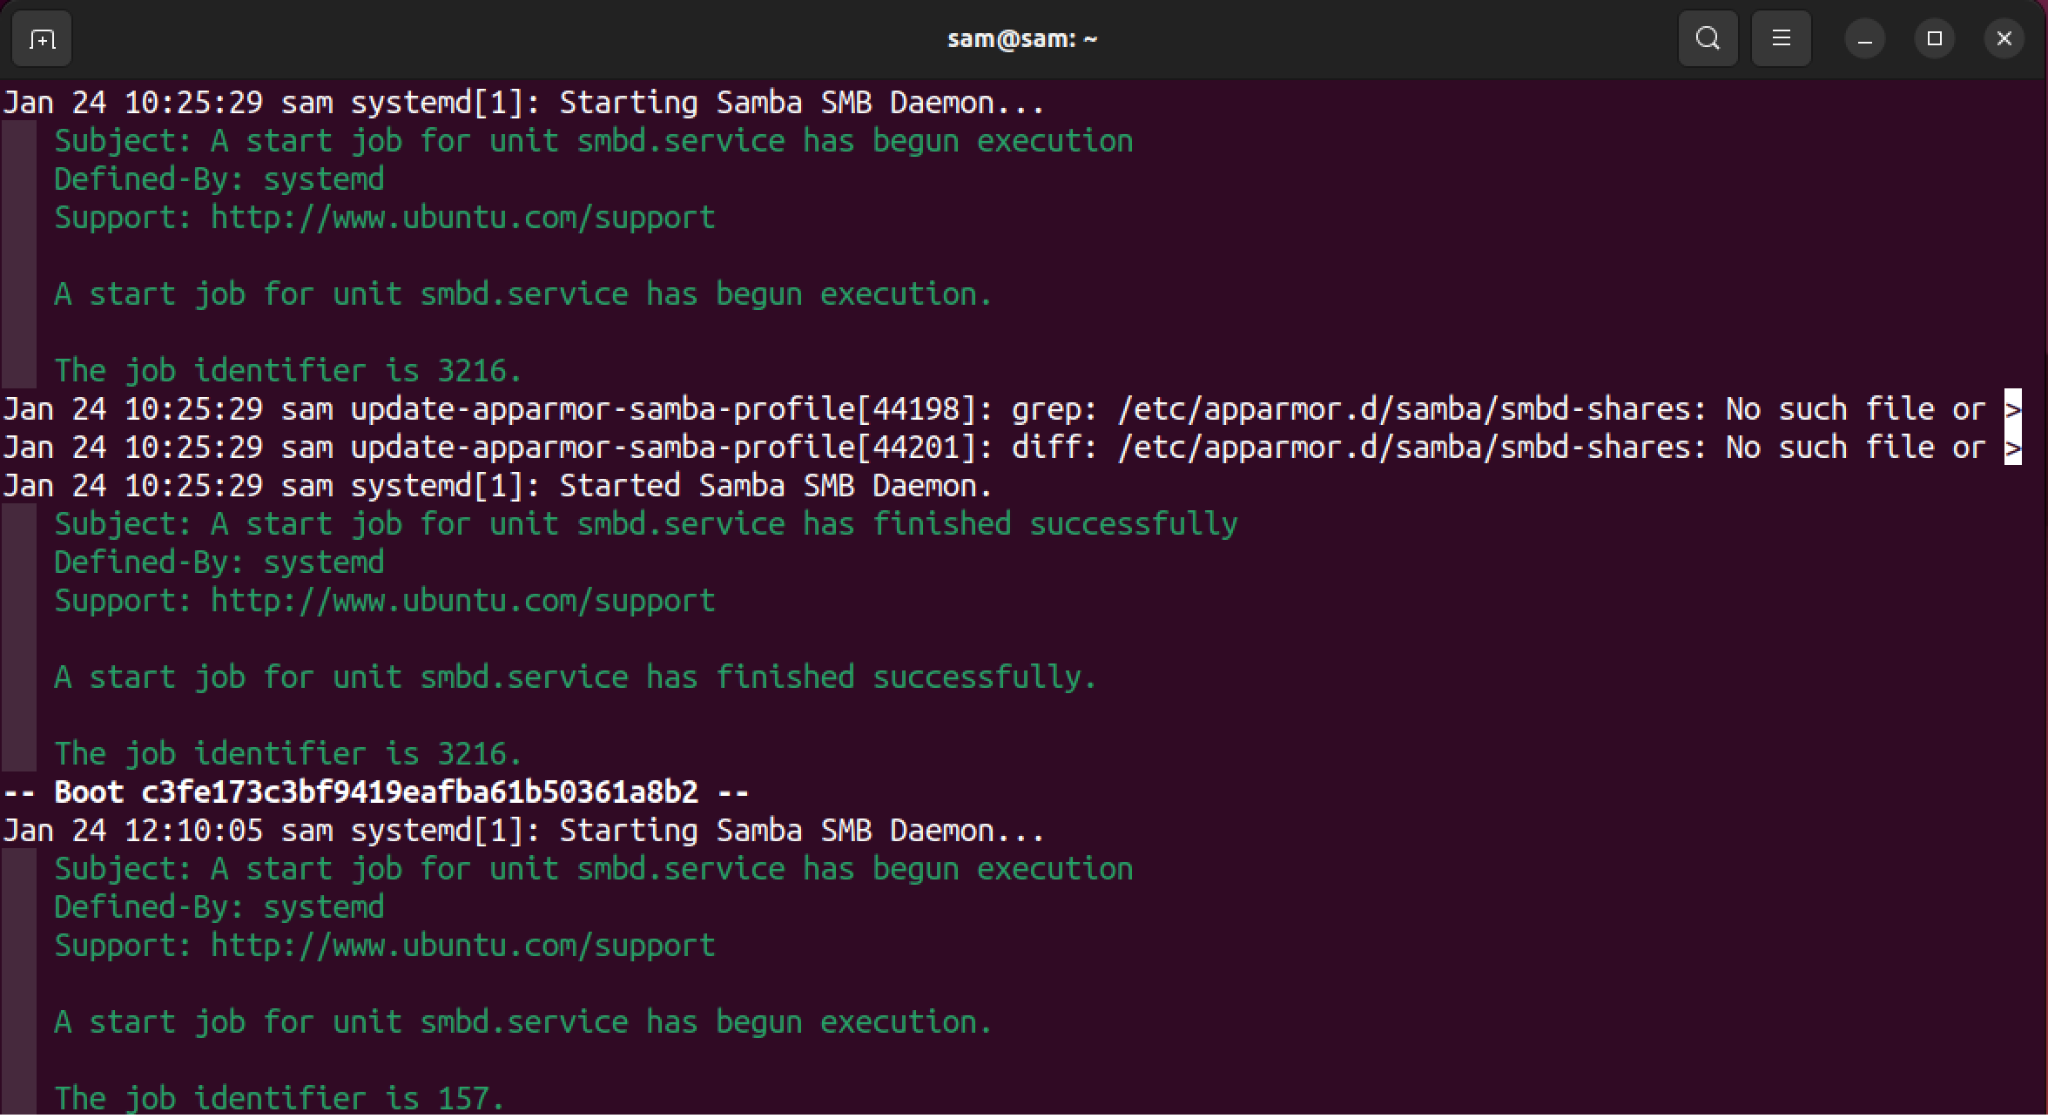
    To get a detailed log overview, use the -x short for –catalog option.

    journalctl -u smbd.service -x


    This will append a short description of the log.


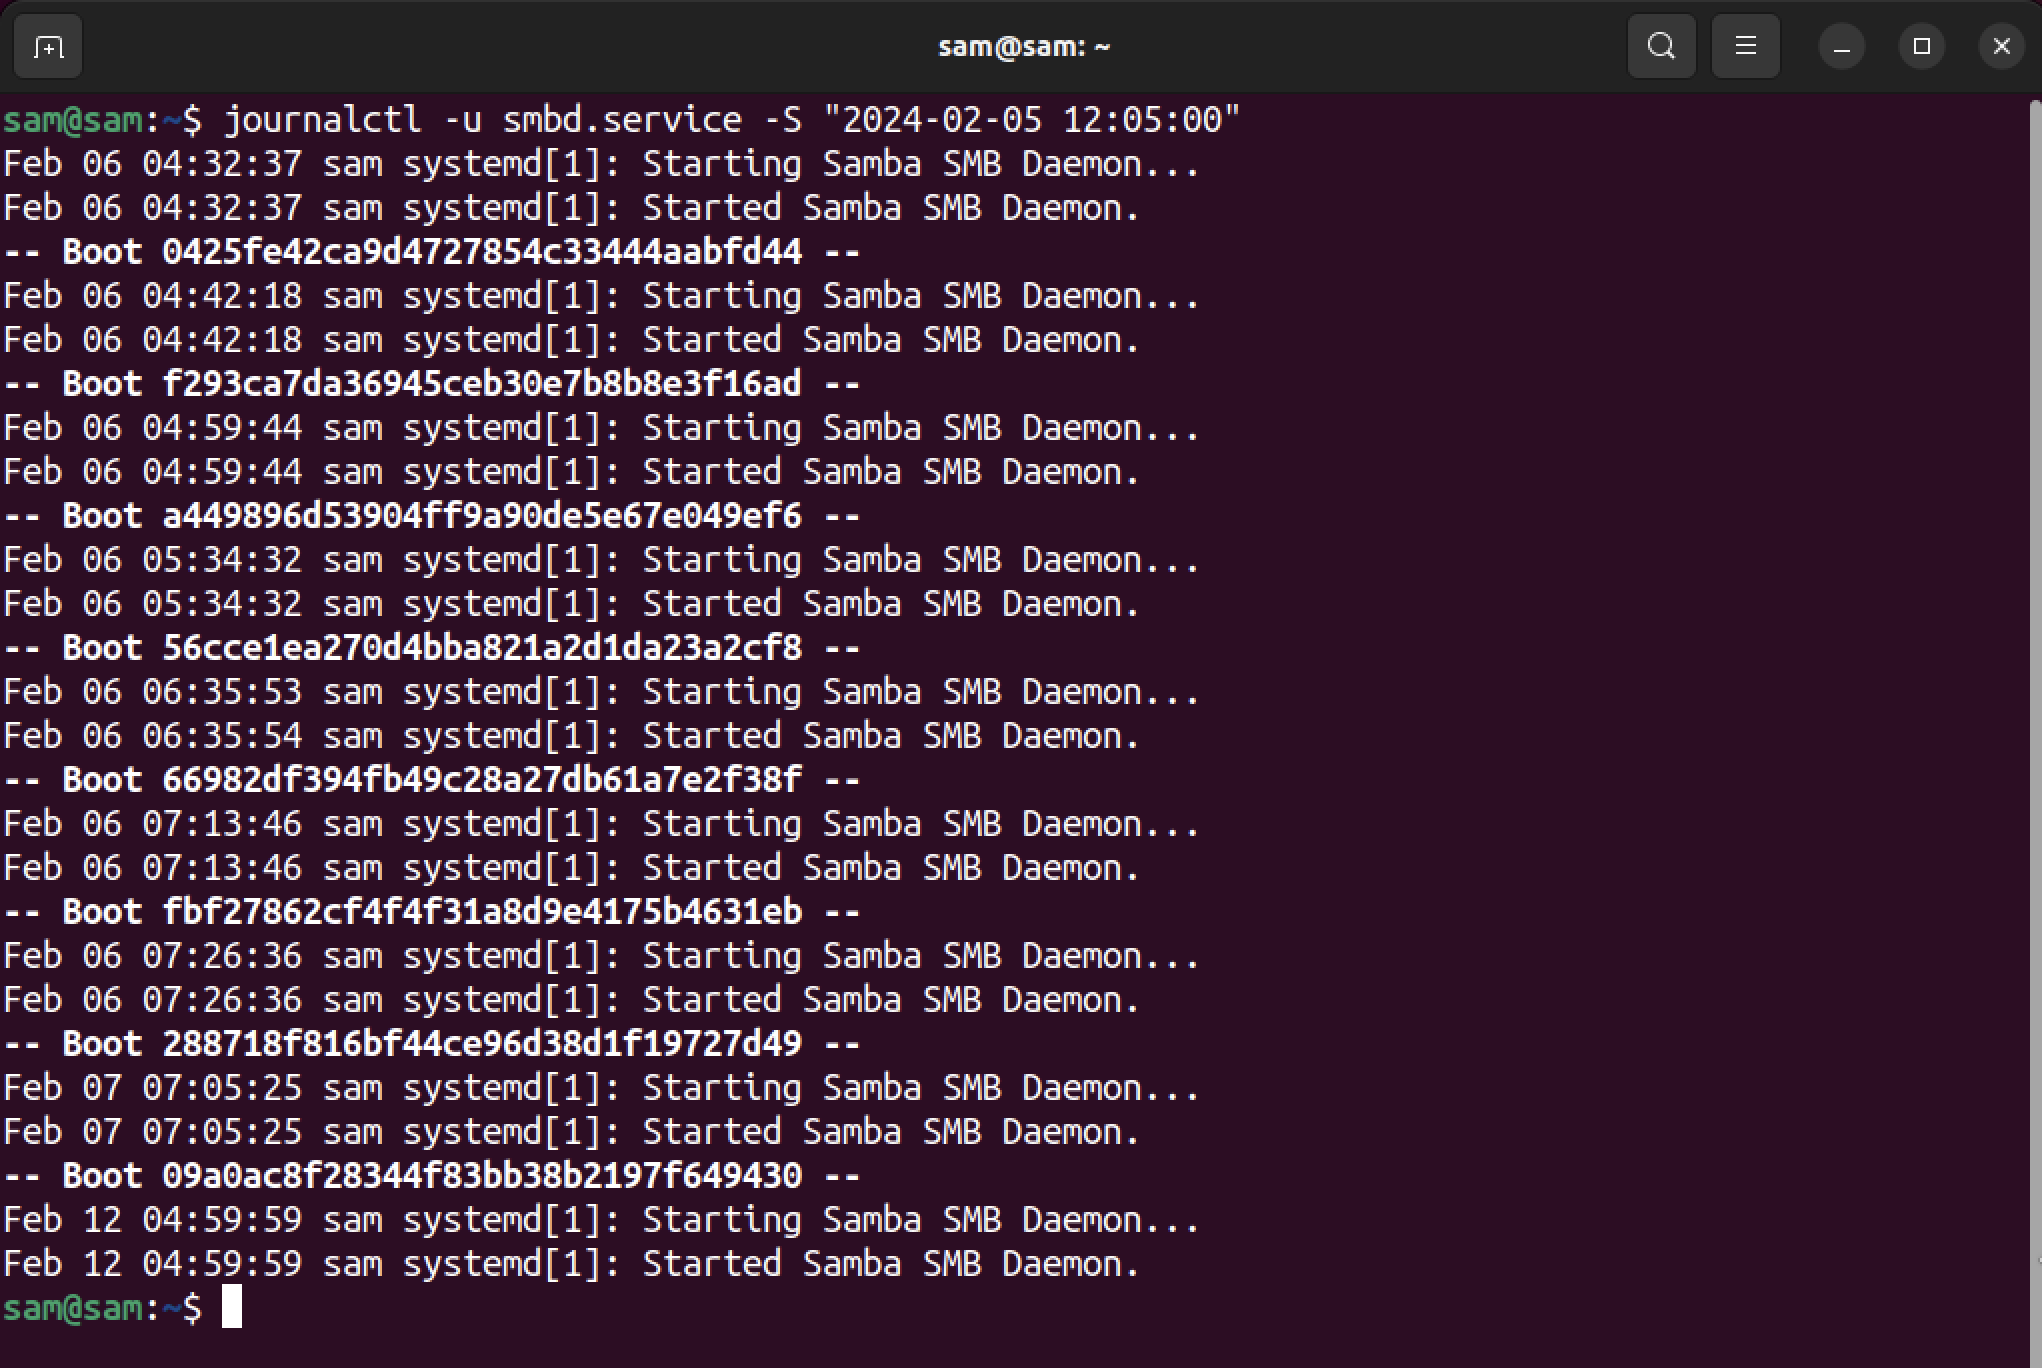
    Now, to print logs based on time using journalctl there are two options, -S short for –since and -U short for –until.

    journalctl -u [unit-name] -S "[year-month-day] [hours:minutes:seconds]"


    For example, to view the logs of unit smbd from 2024:01:30 12:05:00.

    journalctl -u smbd.service -S "2024:01:30 12:05:00"


    Conclusion

    To view the systemd logs of a service, there are two main utilities, journalctl and systemctl. The journalctl is specifically designed for viewing the logs of systemd. However, the systemctl also has an option of printing the log of the service. To print the log of a service use, journalctl -u [unit-name] and systemctl [unit-name].


    More...
      Posting comments is disabled.

    Categories

    Collapse

    Article Tags

    Collapse

    There are no tags yet.

    Latest Articles

    Collapse

    • How to Install ZSH shell on Rocky Linux
      by Kasimba
      In this post I will show you how to install the ZSH shell on Rocky Linux. ZSH is an alternate shell that some people prefer instead of BASH shell. Some people say ZSH has better auto-completion, theme support, and plugin system. If you want to give ZSH a try its quite easy to install and give it a try. This post is focused on the Rocky Linux user and how to install ZSH and get started with its usage.
      Before installing anything new, it’s good practice to update your system packages:...
      12-25-2024, 02:01 AM
    • 5 Compelling Reasons to Choose Linux Over Windows
      by Kasimba


      by George Whittaker


      Introduction

      In the world of operating systems, Windows has long held the lion’s share of the market. Its user-friendly interface and wide compatibility have made it the default choice for many. However, in recent years, Linux has steadily gained traction, challenging the status quo with its unique offerings. What was once considered the domain of tech enthusiasts and developers is now...
      12-21-2024, 06:52 AM
    • NGINX vs Apache; Web Server Comparison
      by Kasimba
      Overview of NGINX and Apache

      NGINX and Apache are leading web server solutions utilized for hosting websites and web applications. Apache, developed by the Apache Software Foundation, offers robust configuration options and extensibility. NGINX, created by Igor Sysoev, is known for its efficiency in handling numerous concurrent connections with low resource utilization. Both servers function not only as HTTP servers but also as reverse proxies, load balancers, and more.

      What is

      ...
      12-21-2024, 03:54 AM
    • Monthly News – November 2024
      by Kasimba
      Hi everyone, I hope you are enjoying the BETA so far! This release introduces new features, tools, and artwork, so we anticipate a good number of bug reports. Every single fix helps us refine and improve the final release. Your feedback during the BETA phase is extremely important to us. Linux Mint 22.1 is our […]

      More...
      12-16-2024, 11:50 AM
    • Mastering OpenSSH for Remote Access on Debian Like a Pro
      by Kasimba


      by George Whittaker


      Introduction

      Remote access is a cornerstone of modern IT infrastructure, enabling administrators and users to manage systems, applications, and data from virtually anywhere. However, with great power comes great responsibility—ensuring that remote access remains secure is paramount. This is where OpenSSH steps in, providing robust, encrypted communication for secure remote management....
      12-13-2024, 10:31 PM
    • Unlocking the Full Potential of Linux's Most Versatile Search Tool
      by Kasimba


      by George Whittaker


      Introduction

      The grep command, short for "global regular expression print," is one of the most powerful and frequently used tools in Unix and Linux environments. From sifting through log files to finding patterns in text, grep is a Swiss Army knife for system administrators, developers, and data analysts alike. However, many users limit themselves to its basic functionality, unaware...
      12-13-2024, 09:24 PM
    Working...
    X